Image Details

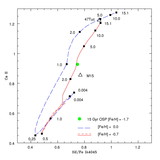
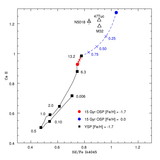
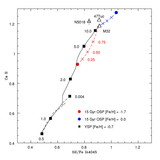
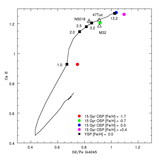
Caption: Fig. 7.
Identical to Fig. 6 but with an expanded scale on the Ca II axis. Also, the interpolations between the OSP points and the YSP points nearest NGC 5018 are shown. The increment crosses along the [Fe/H﹩] =-0.7﹩ and [Fe/H﹩] =0.0﹩ curves have been omitted for clarity.
Other Images in This Article
Copyright and Terms & Conditions
© 2000. The American Astronomical Society. All rights reserved. Printed in U.S.A.
Copyright ©
2025 Astronomy Image Explorer. All Rights Reserved.