Image Details
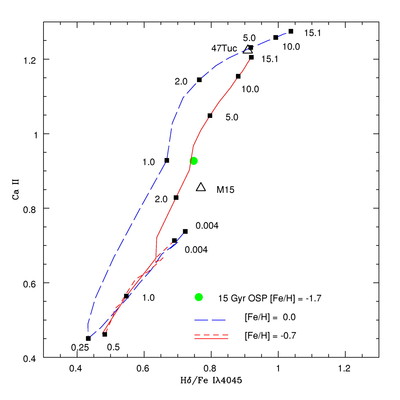
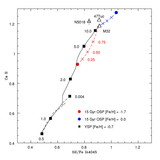
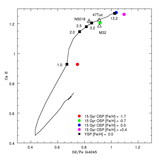
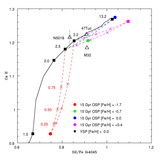
Caption: Fig. 3.
Ca II index is plotted versus the Hδ/λ4045 index for an instantaneous burst of star formation with [Fe/H﹩] =-0.7﹩ (red solid and short‐dashed line) and [Fe/H] = 0.0 (blue long‐dashed line). The colored lines represent the evolution of the index values as the population ages. Various ages (in Gyr) have been marked by solid squares. For clarity, the path from 0.004 to 0.5 Gyr on the [Fe/H] = −0.7 curve has been marked with a short‐dashed line while the evolution subsequent to 0.5 Gyr has been marked with a solid line. An old, metal‐poor model (green circle) is plotted to show the effects of horizontal branch morphology on the indices (see text). The error bars for the labeled globular cluster points (open triangles) are smaller than the plotting symbol.
Other Images in This Article
Copyright and Terms & Conditions
© 2000. The American Astronomical Society. All rights reserved. Printed in U.S.A.