Image Details
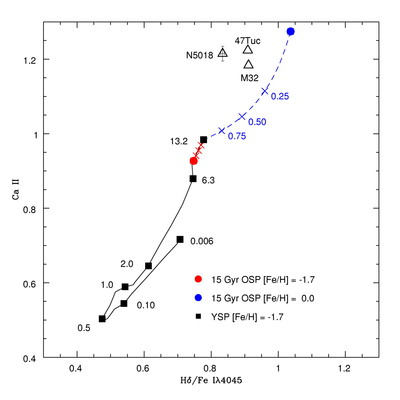
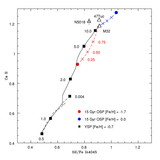
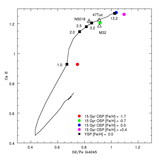
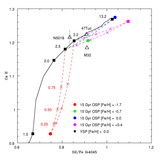
Caption: Fig. 4.
Ca II plotted vs. Hδ/λ4045 for a composite population consisting of a metal‐poor young population ([Fe/H﹩] =-1.7﹩; evolution marked by the solid black curve, with specific ages labeled by the solid squares) and one of two OSP (﹩\mathrm{age}\,=15.1﹩ Gyr) populations ([Fe/H﹩] =-1.7﹩, marked by the solid red circle and [Fe/H﹩] =0.0﹩, marked by the solid blue circle). Dotted lines between the old population point and the 13.2 Gyr YSP point denote interpolations between these two populations with each cross along the OSP [Fe/H﹩] =0.0﹩ curve marked with the fractional contribution of the YSP to the total integrated light at 4000 Å. The crosses along the OSP [Fe/H﹩] =-1.7﹩ curve are similar but have been omitted for clarity. The indices for NGC 5018, M32, and 47 Tuc are plotted as open triangles.
Other Images in This Article
Copyright and Terms & Conditions
© 2000. The American Astronomical Society. All rights reserved. Printed in U.S.A.