Image Details
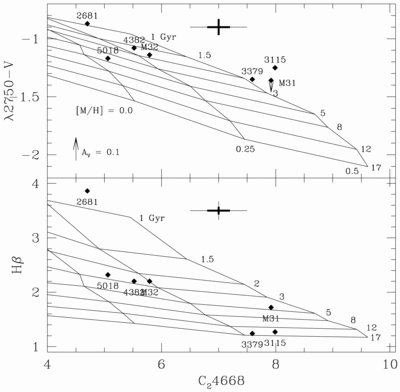
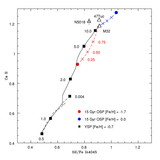
Caption: Fig. 1.
Two age‐sensitive indices, a UV‐visual color and an Hβ index, are plotted vs. metal‐sensitive spectral index C﹩_{2}﹩4668. The color λ2750−﹩V=\mathrm{log}\,F_{\lambda 2750}-\mathrm{log}\,F_{V}﹩ following Burstein et al. (1988) and BBB, and has units of dex rather than magnitudes. The marked dust screen extinction also refers to a straight logarithm, that is, ﹩A_{V}=0.1﹩ dex, or 0.25 mag. The ﹩\lambda 2750﹩ passband is an average of BBB and Burstein et al. (1988) data from ﹩\lambda 2650﹩ to ﹩\lambda 2850﹩ with their extinction corrections applied. Optical spectral indices on the Lick system come from Trager et al. (1998). The optical data were taken from a significantly smaller aperture than the IUE UV data, so the C﹩_{2}﹩4668 index should be weakened somewhat (a few tenths of Å) to compensate for this mismatch in the upper panel. Error bars in bold refer to M32 and M31 data, wider bars to the rest of the sample. Models from Worthey (1994) appear as a grid labeled by scaled solar metallicity and age in Gyr. Models are scaled solar and thus do not track element overenhancements. Such an effect probably exists for the C﹩_{2}﹩4668 index; the larger galaxies have a C﹩_{2}﹩4668 index stronger than their average abundance would dictate. In the upper panel, an arrow attached to M31 is an estimate of the effect of subtracting the hot star component (which is not included in the models) from the spectrum, as modeled by Worthey et al. (1996). The indicated effect is an underestimate because Worthey et al. (1996) maximized the contribution from very hot pulsating asymptotic giant branch stars. Similar corrections should be made for NGC 3115 and NGC 3379, but we lack appropriate spectrophotometric data. NGC 3115 has a UV upturn similar to M31, but NGC 3379 has considerably more UV flux, so its correction is likely to be quite large. The other galaxies have very weak UV emission so that their corrections are negligible. Large corrections for emission fill‐in in the Hβ index are unlikely for the galaxies plotted. If corrections are applied, galaxies move vertically to younger ages and somewhat higher abundance.
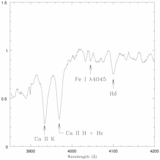
Other Images in This Article
Copyright and Terms & Conditions
© 2000. The American Astronomical Society. All rights reserved. Printed in U.S.A.