Image Details
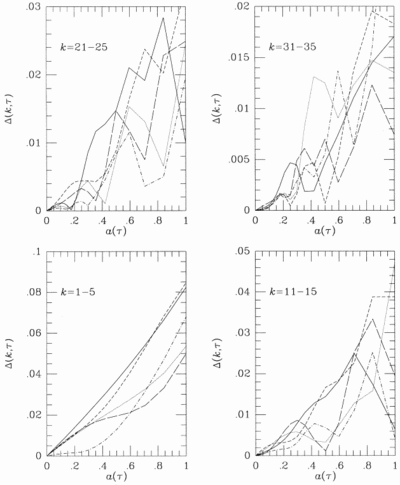
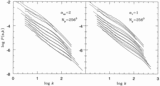
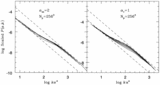
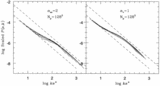
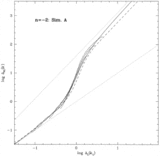
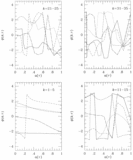
Caption: Fig. 10.
Amplitude trajectories for n = −2. The trajectories of the amplitudes Δ(k, τ) of individual Fourier modes for n = −2 are plotted vs. a, as in Fig. 9 for the phase. Note that at early times Δ ∝ a: to check this, all the curves have been joined to Δ = 0 at a = 0. Therefore the lowest value of a at which departures from a straight line occur shows nonlinear behavior.
Other Images in This Article
Show More
Copyright and Terms & Conditions
© 1998. The American Astronomical Society. All rights reserved. Printed in U.S.A.
Copyright ©
2025 Astronomy Image Explorer. All Rights Reserved.