Image Details
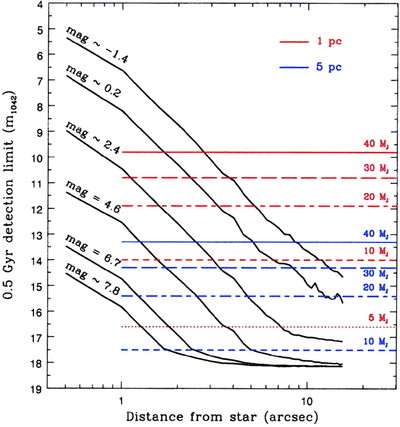
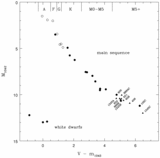
Caption: Fig. 11.
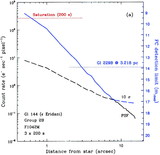
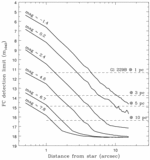
Theoretical limits of sensitivity to brown dwarfs aged 0.5 Gyr through F1042M. The black curves are the same photometric detection limits shown in Fig. 5. The horizontal lines represent the apparent brightnesses of brown dwarfs with masses 40 (solid lines), 30 (long‐dashed lines), 20 (long‐dash–short‐dashed lines), 10 (short‐dashed lines), and 5 MJ (dotted line) and with distances 1 (red lines) and 5 pc (blue lines). The F1042M magnitudes of the brown dwarfs were determined using the predicted J magnitudes from the models of Burrows et al. (1997) and an assumed constant value of m1042−J = 1 for all brown dwarfs within the considered ranges of mass and age. See text for details and caveats.
Other Images in This Article
Show More
Copyright and Terms & Conditions
© 2000. The American Astronomical Society. All rights reserved. Printed in U.S.A.