Image Details
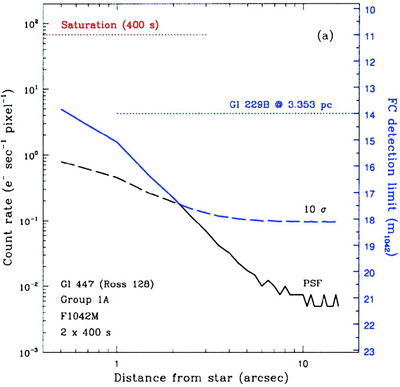
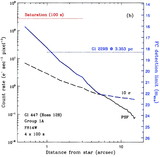
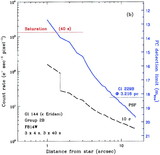
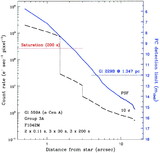
Caption: Fig. 2.
FC detection limits for PC images of Gl 447 (Ross 128) through (a) F1042M and (b) F814W. This star’s V magnitude is average for the targets in group 1; the detection limits are therefore typical for group 1 targets. The solid curves labeled "PSF" are the azimuthally averaged, radial profiles of the target’s images. The dashed curves labeled "10 σ" trace the signal level equal to 10 times the photon and read noise, combined in quadrature. The dotted red lines show the level of detector saturation for the longest exposure through each filter. Those portions of the PSF and 10 σ curves that mark the FC detection limit are shown in blue. See § 3.1 for an explanation of the detection‐limit criteria. The dotted blue lines labeled "Gl 229B" reflect the apparent magnitudes of a Gl 229B–like brown dwarf projected to the distance of the target.
Other Images in This Article
Show More
Copyright and Terms & Conditions
© 2000. The American Astronomical Society. All rights reserved. Printed in U.S.A.