Image Details
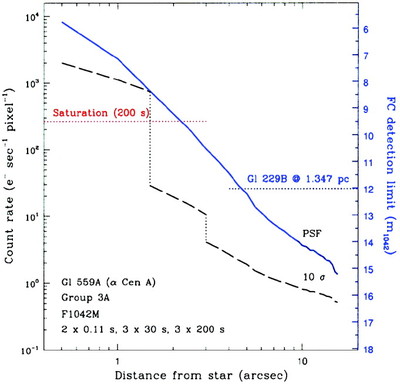
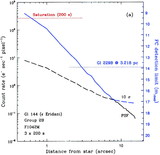
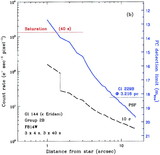
Caption: Fig. 4.
FC detection limits for PC images of Gl 559A (α Centauri A) through F1042M. This star’s V magnitude is average for the targets in group 3; the detection limits are therefore typical for group 3 targets. All curves and symbols are as described in the legend to Fig. 2 and in § 3.1. The discontinuities in the 10 σ curve at ~1﹩\farcs﹩5 and 3﹩\arcsec﹩ mark the transitions between the 0.11, 30, and 200 s exposure sets.
Other Images in This Article
Show More
Copyright and Terms & Conditions
© 2000. The American Astronomical Society. All rights reserved. Printed in U.S.A.
Copyright ©
2025 Astronomy Image Explorer. All Rights Reserved.