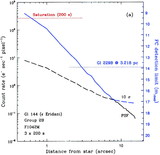
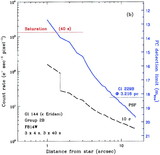
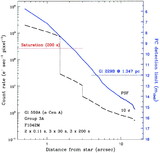
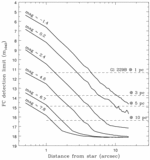
Image Details
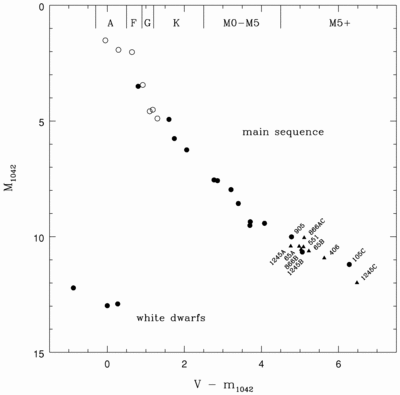
Caption: Fig. 7.
Color‐magnitude diagram of all program targets and their companions. Values of m1042 were obtained by using the technique of Holtzman et al. (1995a) for WFPC2 point‐source photometry (filled circles), by comparing unsaturated regions of the targets’ PSFs with those of comparably exposed stars for which aperture photometry was obtained (open circles), or by fitting appropriately scaled and registered binary‐PSF models generated by Tiny Tim (triangles). The colors and absolute magnitudes were computed using values of V and d from Table 1. The uncertainties of these data are listed in Table 3 and are smaller than the plotted symbols. The data for targets with spectral types later than M5 V are labeled by their CNS3 numbers (Gl or GJ).
Other Images in This Article
Show More
Copyright and Terms & Conditions
© 2000. The American Astronomical Society. All rights reserved. Printed in U.S.A.