

Image Details
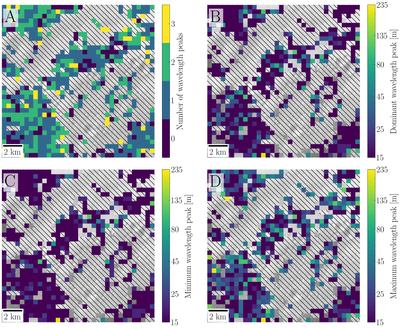
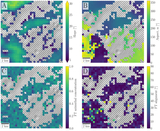
Caption: Figure 8.
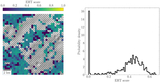
Map of peak wavelengths for the Connecting Ridge site (A306) computed in a moving 474 × 474 m frame (64 ppd). (A) Number of wavelength peaks in each frame, (B) dominant wavelength (the peak with the highest normalized power), (C) minimum peak wavelength, and (D) maximum peak wavelength. Crosshatched areas denote regions of the DEM that had insufficient stereo coverage for shape-from-shading and were excluded from our analysis. In this region, frames exhibit a wide range of peak wavelengths, but shorter wavelength peaks are more common.
Other Images in This Article
Show More
Copyright and Terms & Conditions
© 2026. The Author(s). Published by the American Astronomical Society.

Copyright ©
2026 Astronomy Image Explorer. All Rights Reserved.
