

Image Details
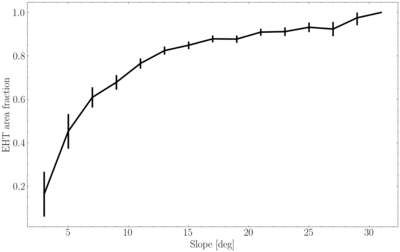
Caption: Figure 10.
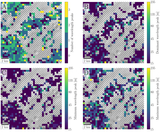
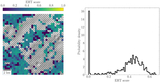
Fraction of analysis frames meeting spectral thresholds for EHT (Section 4.1) as a function of the LOLA-derived background slope gradient, aggregated over the 13 Artemis candidate landing regions. Error bars denote the binomial proportion confidence interval.
Other Images in This Article
Show More
Copyright and Terms & Conditions
© 2026. The Author(s). Published by the American Astronomical Society.

Copyright ©
2026 Astronomy Image Explorer. All Rights Reserved.
