

Image Details
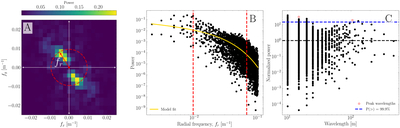
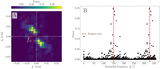
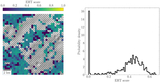
Caption: Figure 5.
(A) 2D power spectrum of the slope frame from Figure 3(B). Radial frequency is defined as the distance of each point from the center of the spectrum in frequency space. (B) The resulting 1D radial power spectrum. The solid line indicates a best-fit power-law model, and the vertical dashed line denotes the dominant peaks, found by (C) normalizing the radial power spectrum by the model fit, binning by wavelength, and identifying wavelengths where the normalized power exceeds a prescribed confidence level.
Other Images in This Article
Show More
Copyright and Terms & Conditions
© 2026. The Author(s). Published by the American Astronomical Society.

Copyright ©
2026 Astronomy Image Explorer. All Rights Reserved.
