

Image Details
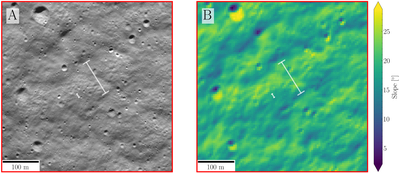
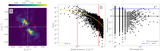
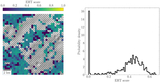
Caption: Figure 3.
(A) NAC 1 m pxl−1 south polar mosaic (solar azimuth 355∘) of the red inset region in Figure 1. (B) 5 m pxl−1 slope map of the same area, computed from the S. Bertone et al. (2026) DEM, where the local downslope direction is toward the upper left of the frame. The orientation and width of the white brackets denote the mean azimuth (Section 3.3) and peak wavelengths, 15 and 105 m (Section 3.4), of the resulting 2D power spectrum.
Other Images in This Article
Show More
Copyright and Terms & Conditions
© 2026. The Author(s). Published by the American Astronomical Society.

Copyright ©
2026 Astronomy Image Explorer. All Rights Reserved.
