

Image Details
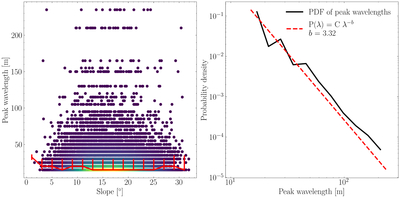
Caption: Figure 12.
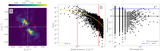
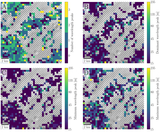
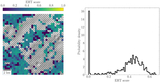
(Left) Peak wavelength as a function of regional-scale slope derived from the 64 ppd LOLA SLDEM, aggregated over the 13 Artemis candidate landing regions. Points are colored by density, and the red line indicates the binned median with error bars denoting lower and upper quartiles. (Right) Probability density function of peak wavelengths across all 13 Artemis landing region DEMs. The scale of quasiperiodic peaks does not appear to be correlated with slope, but the peak distribution roughly follows a power-law distribution, with short wavelengths more common than long wavelengths (Section 4.3).
Other Images in This Article
Show More
Copyright and Terms & Conditions
© 2026. The Author(s). Published by the American Astronomical Society.

