

Image Details
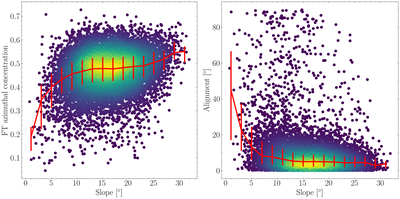
Caption: Figure 11.
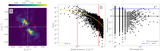
Azimuthal concentration (left) and alignment (right) of the 2D Fourier transform as a function of regional-scale slope derived from the 64 ppd LOLA SLDEM, aggregated over the 13 Artemis candidate landing regions. Points are colored by density, and the red line indicates the binned median with error bars denoting lower and upper quartiles. Both quantities are weakly correlated with slope over the range of slopes represented in our sample of DEMs (Section 4.2).
Other Images in This Article
Show More
Copyright and Terms & Conditions
© 2026. The Author(s). Published by the American Astronomical Society.

Copyright ©
2026 Astronomy Image Explorer. All Rights Reserved.
