

Image Details
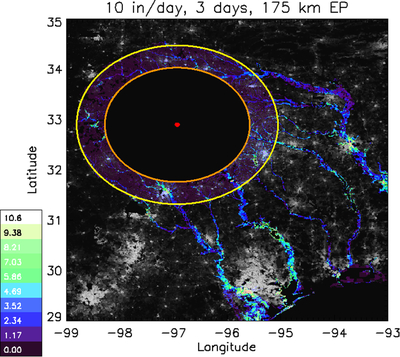
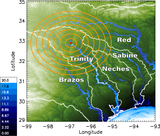
Caption: Figure 16.
Map view of natural log of exposed population (EP) at the worst-case scenario (WCS: 10 inches (25.4 cm) per day for 3 days and 175 km radius); color scale shows natural-log EP per pixel, the impact location is shown as a red dot, the 2 psi blast radius is shown in orange, and the 175 km hydrophobic radius is shown in yellow. This is overlaying a black-and-white natural-log map of population in eastern Texas (Center For International Earth Science Information Network-CIESIN-Columbia University 2017), with the population within the 2 psi blast radius excluded.
Other Images in This Article


Show More
Copyright and Terms & Conditions
© 2026. The Author(s). Published by the American Astronomical Society.

Copyright ©
2026 Astronomy Image Explorer. All Rights Reserved.
