

Image Details
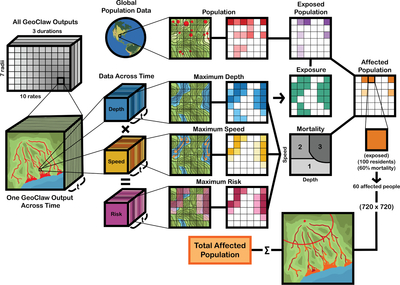
Caption: Figure 7.
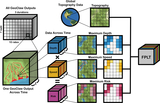
Flow chart of the GeoClaw-output to affected-population-summary pipeline. Of the 210 GeoClaw outputs produced, one scenario is examined, which includes water-depth and water-speed data across time. These values are multiplied to yield risk values across time. The maximum of all three parameters are then used as inputs to a mortality function, generating a map of maximum mortality for the scenario. Separately, maximum water depth also produces a map of exposure, which is compared to population data of the same resolution to create a map of exposed population. This is then used in combination with the mortality map to estimate affected population. All 720 by 720 of the 30″ pixels within a single GeoClaw output go through this process to generate the total affected population for that scenario.
Other Images in This Article


Show More
Copyright and Terms & Conditions
© 2026. The Author(s). Published by the American Astronomical Society.

