

Image Details
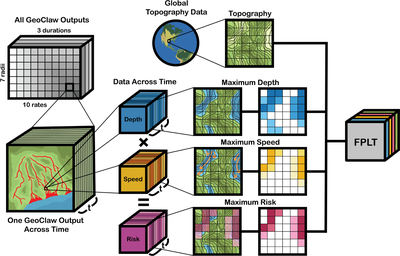
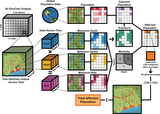
Caption: Figure 8.
GeoClaw-output to flood-parameter look-up table (FPLT) flow chart showing how topography, water depth, water speed, and risk layers are generated and stored within an FPLT.
Other Images in This Article


Show More
Copyright and Terms & Conditions
© 2026. The Author(s). Published by the American Astronomical Society.

Copyright ©
2026 Astronomy Image Explorer. All Rights Reserved.
