

Image Details
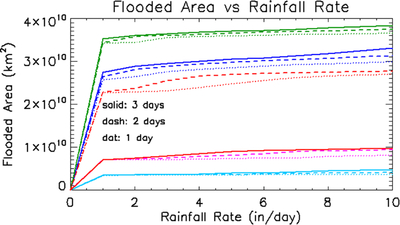
Caption: Figure 13.
Plot of flooded area versus rainfall rate for the 175 km radius scenarios comparing individual river-basin values at each duration. The Trinity River is shown in green, Brazos in dark blue, the Red River in red, Sabine in hot pink, and Neches in teal. The 3 days duration is solid, the 2 days duration is dashed, and the 1 day duration is dotted.
Other Images in This Article


Show More
Copyright and Terms & Conditions
© 2026. The Author(s). Published by the American Astronomical Society.

Copyright ©
2026 Astronomy Image Explorer. All Rights Reserved.
