

Image Details
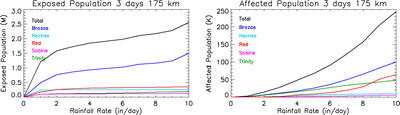
Caption: Figure 11.
Plots of exposed (left) and affected (right) populations versus rainfall rate for the 3 days and 175 km radius scenarios comparing total and individual river-basin values. The total values are shown in black, Trinity is shown in green, Brazos in dark blue, the Red River in red, Sabine in hot pink, and Neches in teal. Notably, the exposed population rises quickly to a plateau while the affected population continues to rise exponentially.
Other Images in This Article


Show More
Copyright and Terms & Conditions
© 2026. The Author(s). Published by the American Astronomical Society.

Copyright ©
2026 Astronomy Image Explorer. All Rights Reserved.
