

Image Details
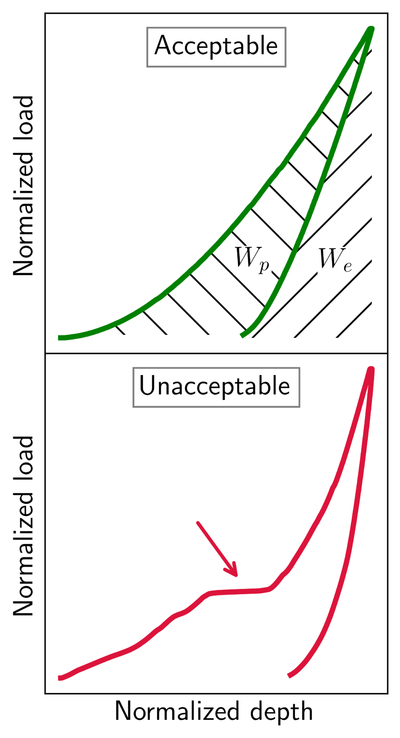
Caption: Figure 2.
Exemplifying nanoindentation curves, showing the applied load with respect to the nanoindenter contact depth. For comparison purposes, the curves have been normalized to the maximum depth and maximum applied load. Top: an acceptable nanoindentation curve, being smooth with no appreciable sudden changes in the trend. The total work applied to the system (WT) corresponds to the full area under the loading curve. The recovered elastic energy (We, forward-slash hatching) is the area under the unloading curve, while the retained plastic work (Wp, backslash hatching) is the area between the loading and unloading curves. Bottom: an unacceptable curve that can lead to misleading results. This curve features a major pop-in event, indicated by an arrow. These kinds of unacceptable curves were filtered with the dh/dL method (Appendix).
Other Images in This Article
Copyright and Terms & Conditions
© 2026. The Author(s). Published by the American Astronomical Society.

