

Image Details
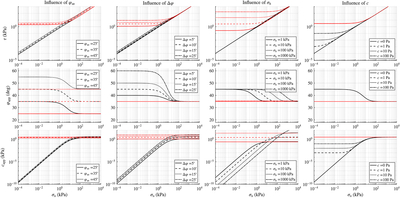
Caption: Figure 4.
Parametric study of the nonlinear failure envelope model parameters. Top row: the shear strength as a function of normal stress. Middle row: the apparent friction angle as a function of normal stress. Bottom row: the apparent cohesion as a function of normal stress. The left column shows the influence of changing φ∞ within the range of 25° to 45°. The second column shows the influence of changing Δφ within the range of 5° to 25°. The third column shows the influence of changing σh within the range of 1 to 1000 kPa. The fourth column shows the influence of changing c within the range of 0 to 100 Pa. The black lines show the values taking into account the nonlinear model and the red lines show the linear Mohr–Coulomb model results (derived from a linear fit to data in the range [σh, 104] kPa, where η ≥ 1). The line style (for red and black lines) indicates the parameter value as indicated in the legend. Only one variable is modified at a time. The reference values of the parameters when not being varied are (the same used in Figure 2) φ∞ = 35°, Δφ = φ0 − φ∞ = 10°, σh = 10 kPa, and c = 0 Pa.
Other Images in This Article
Copyright and Terms & Conditions
© 2026. The Author(s). Published by the American Astronomical Society.

