

Image Details
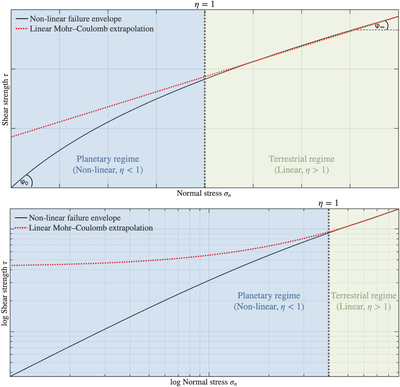
Caption: Figure 1.
Schematic of the linear vs. nonlinear failure envelopes. Demonstrative example comparing the linear (red) and nonlinear (black) failure envelopes of regolith shown on both a linear scale (top) and log scale (bottom). The two figures show the same data. The log scale is adopted later in this work to show the results the low confining stress levels relevant to low-gravity planetary bodies. In the top figure, φ0 represents the low stress friction angle and φ∞ represents the high stress friction angle. The nonlinearity index η = σn/σh represents the transition to nonlinear behavior that occurs at η < 1. The linear Mohr–Coulomb model (shown in red) is extrapolated from a linear fit to data in the range where η > 1. The terrestrial regime with nonlinearity index η > 1 is shaded in green and the planetary nonlinear regime η < 1 is shaded in blue. We note that when η ≫ 1 the failure envelope can become nonlinear again, but this is not the focus of the current work.
Other Images in This Article
Copyright and Terms & Conditions
© 2026. The Author(s). Published by the American Astronomical Society.

