

Image Details
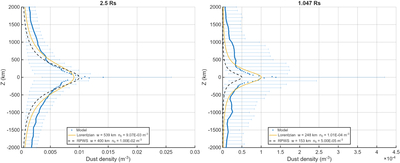
Caption: Figure 12.
Comparison between the modeled and Cassini-derived vertical dust density profiles near the Janus/Epimetheus orbit and in the region between the D ring and Saturn at Phase 90°. The left panel shows the profile at 2.5RS, and the right panel shows the profile at 1.047RS. Blue circles denote the azimuthally averaged model profiles, with error bars indicating the azimuthal minimum and maximum values. Yellow curves show Lorentzian fits to the model results, and black dashed curves indicate representative Cassini-derived profiles from RPWS/CDA measurements (S.-Y. Ye et al. 2018a, 2018b; H.-W. Hsu et al. 2018).
Other Images in This Article
Show More
Copyright and Terms & Conditions
© 2026. The Author(s). Published by the American Astronomical Society.

