

Image Details
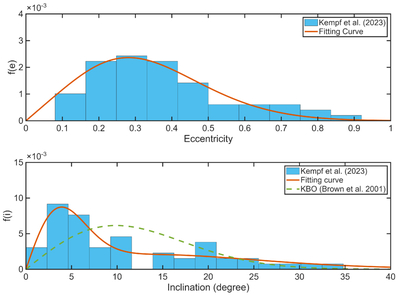
Caption: Figure 3.
Orbital parameter distributions of micrometeoroids detected by Cassini’s CDA (S. Kempf et al. 2023): (a) eccentricity distribution f(e) and (b) inclination distribution f(i). The red curves show the fitting Rayleigh functions, while the green dashed curve in panel (b) represents the inclination distribution of Kuiper Belt objects from M. E. Brown (2001).
Other Images in This Article
Show More
Copyright and Terms & Conditions
© 2026. The Author(s). Published by the American Astronomical Society.

Copyright ©
2026 Astronomy Image Explorer. All Rights Reserved.
