

Image Details
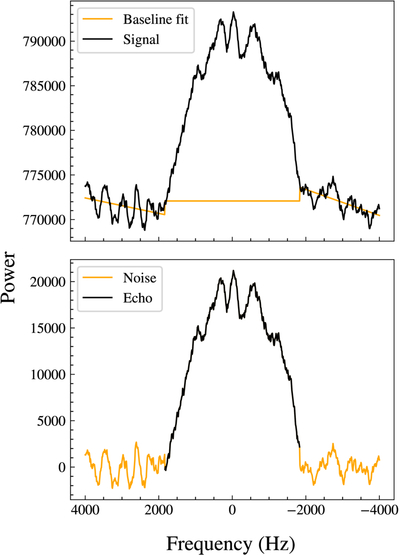
Caption: Figure 2.
(Top) Power spectrum of the 2011 October 3 Goldstone SC echo after smoothing by the Savitzky–Golay filter. Also shown is the fitted noise baseline exhibiting discontinuities at the two frequencies corresponding to the approaching and receding limbs (see text). (Bottom) Power spectrum of the smoothed echo after baseline subtraction. The y-axis represents echo power in arbitrary units.
Other Images in This Article
Show More
Copyright and Terms & Conditions
© 2026. The Author(s). Published by the American Astronomical Society.

Copyright ©
2026 Astronomy Image Explorer. All Rights Reserved.
