

Image Details
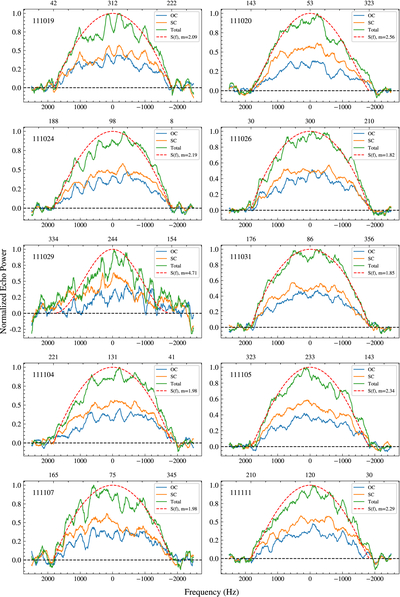
Caption: Figure D1.
Reduced echo power spectra for Goldstone observations, with the epoch shown on each panel as YYMMDD. The blue, orange, and green lines represent the OC, SC, and total (OC+SC) echo power, respectively. The power is normalized to the total echo power’s maximum. The red dashed line represents the scattering law S(f) with the fitted exponent m. The number at the top center of the panel is the subradar west longitude in degrees, whereas the numbers on the left and right are the west longitudes of the target’s approaching (left) and receding (right) limbs, respectively. Note that frequency on the x-axis increases from right to left.
Other Images in This Article
Show More
Copyright and Terms & Conditions
© 2026. The Author(s). Published by the American Astronomical Society.

