

Image Details
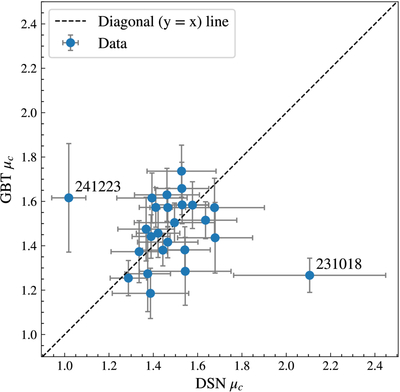
Caption: Figure C1.
Comparison of Goldstone and GBT circular polarization ratios (μc) for 25 epochs where both quantities are available. The error bars represent the uncertainties in the polarization ratios listed in Tables 4 and 5. The dashed diagonal (y = x) line denotes the expected one-to-one relation if the polarization ratios measured at the two telescopes were identical. The two outliers are labeled by their observing epoch (YYMMDD). Possible explanations for the outliers include unusually large errors in receiver gain or system temperature estimates, undetected internal or external radio frequency interference, unidentified data-taking anomalies, imperfect baseline subtraction, or a combination of factors.
Other Images in This Article
Show More
Copyright and Terms & Conditions
© 2026. The Author(s). Published by the American Astronomical Society.

