

Image Details
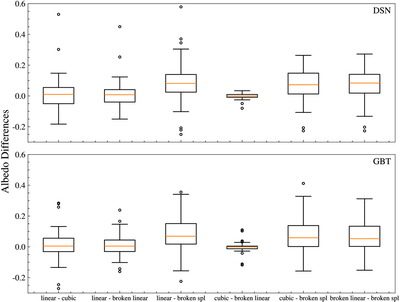
Caption: Figure B2.
Box-and-whisker plot showing pairwise albedo differences obtained with different baseline removal techniques. On the x-axis, “linear” represents the linear fit, “cubic” represents the cubic polynomial fit, “broken linear” represents the broken linear fit, and “broken spl” represents the broken spline fit. Thus, “linear – cubic” represents the difference between the albedos calculated with the linear fit and those calculated with the cubic polynomial fit. Other x-axis labels follow the same pattern. The top panel is for the DSN antenna at Goldstone, and the bottom panel is for the GBT. For both telescopes, the difference between the cubic fit and the broken linear fit is the smallest, with a median value of −0.0008. The orange line indicates the median, the box indicates the interquartile range (IQR), and the whiskers indicate the minimum and maximum (defined as the first quartile minus 1.5 × IQR and the third quartile plus 1.5 × IQR, respectively). The dots outside the box-and-whisker are the outliers.
Other Images in This Article
Show More
Copyright and Terms & Conditions
© 2026. The Author(s). Published by the American Astronomical Society.

