

Image Details
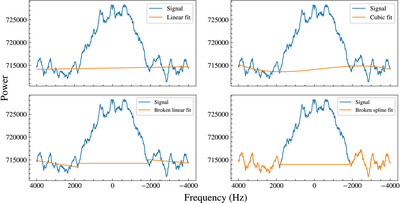
Caption: Figure B1.
Illustration of four different fits of the noise baseline for the Goldstone OC data at epoch 2011 October 3. The upper left panel shows the linear fit, the upper right panel shows the cubic fit, the lower left panel shows the broken linear fit, and the lower right panel shows the broken spline fit. For each panel, the blue line represents the data (after smoothing by the Savitszky–Golay filter), and the orange line represents the fitted noise baseline. For the bottom two panels, there are abrupt changes in the fitted baselines at the edges of the echo because we took the average of the end point of the left fit and the start point of the right fit for the baseline right beneath the echo, as described in the text.
Other Images in This Article
Show More
Copyright and Terms & Conditions
© 2026. The Author(s). Published by the American Astronomical Society.

