

Image Details
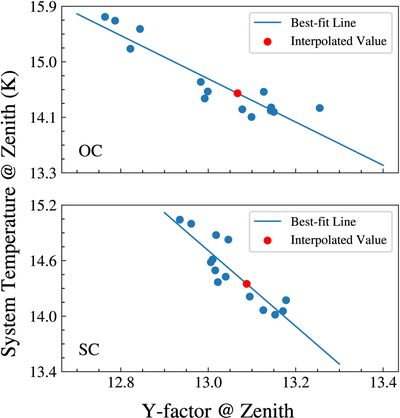
Caption: Figure A1.
Scatter plot of Goldstone zenith system temperatures in kelvins versus Goldstone zenith y-factor. The top panel is for channel 1, or the OC signal, and the bottom panel is for channel 2, or the SC signal. The blue dots represent the epochs where we have both the zenith system temperature and the zenith y-factor measurements. The blue line is the least-squares fit to the blue dots. The red dots represent the epoch (2011 November 23) for which we only have the zenith y-factor measurement. We interpolated its zenith system temperatures using the fitted linear relations.
Other Images in This Article
Show More
Copyright and Terms & Conditions
© 2026. The Author(s). Published by the American Astronomical Society.

Copyright ©
2026 Astronomy Image Explorer. All Rights Reserved.
