

Image Details
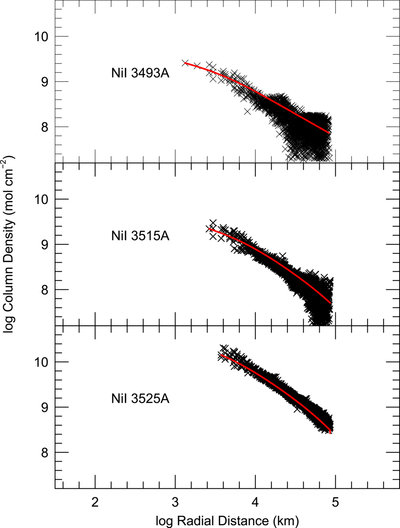
Caption: Figure 5.
The column densities of three of the Ni I lines are shown as a function of cometocentric distance. The model fits are marked with a red line. Again, the error bars for most of these data are smaller than the data points in the plot for the inner coma. The largest error bars are ±0.375 far from the optocenter for Ni 3493 Å.
Other Images in This Article
Copyright and Terms & Conditions
© 2026. The Author(s). Published by the American Astronomical Society.

Copyright ©
2026 Astronomy Image Explorer. All Rights Reserved.
