

Image Details
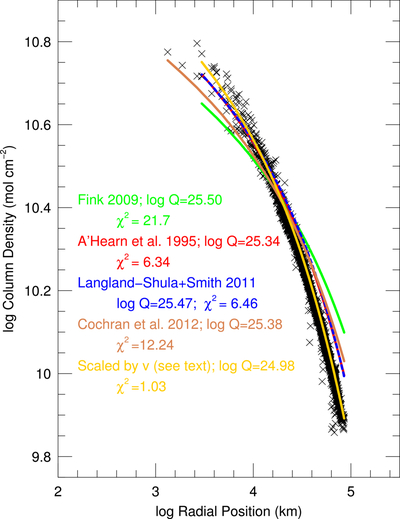
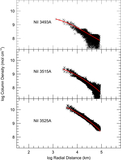
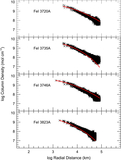
Caption: Figure 3.
The column densities for CN are shown as a function of distance to the optocenter. We computed Haser model production rates (see text) for each molecule’s distribution. As discussed in the text, there are several widely used scale lengths to convert from column densities to production rate. Fits for several scale lengths from the literature are shown, along with a set of scale lengths that were scaled from a standard set (see text).
Other Images in This Article
Copyright and Terms & Conditions
© 2026. The Author(s). Published by the American Astronomical Society.

Copyright ©
2026 Astronomy Image Explorer. All Rights Reserved.
