

Image Details
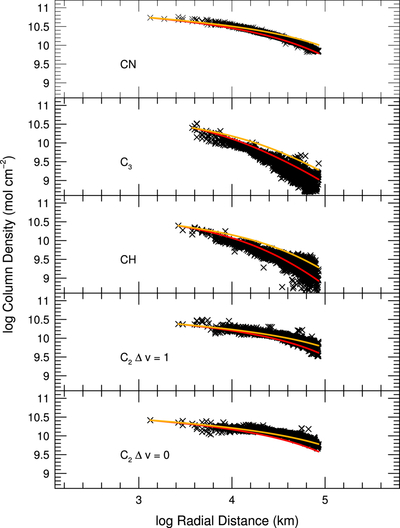
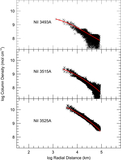
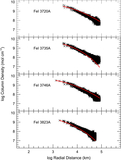
Caption: Figure 4.
The column densities for CN, C3, CH, and C2 (two bands) are shown as a function of distance to the optocenter. Models using the scale lengths of A. L. Cochran et al. (2012) are shown with orange lines. Models using scale lengths that are scaled by the low velocity of 3I (0.3 km s−1) are shown with red lines. The error bars in the inner coma are smaller than the point markers. Even the least reliable column densities, those for C3 and CH, have log column density error bars less than ±0.1 for the data at the largest distances from the optocenter.
Other Images in This Article
Copyright and Terms & Conditions
© 2026. The Author(s). Published by the American Astronomical Society.

Copyright ©
2026 Astronomy Image Explorer. All Rights Reserved.
