

Image Details
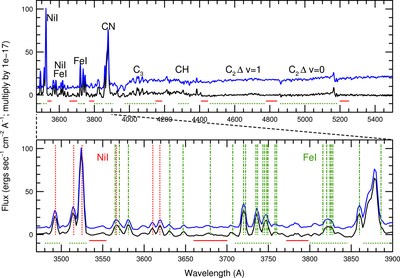
Caption: Figure 2.
A spectrum from a spaxel near the optocenter is shown. The complete spectrum is displayed in the upper panel, with features identified. The blue spectrum is the comet spectrum with the solar continuum spectrum reflected off cometary dust imposed on the comet spectrum. The black spectrum is the same spectrum but with the dust removed (see Section 3). The lower panel is an expanded view of the bluer end of the spectrum. There are many atomic Ni I and Fe I features identified in the lower panel with the Ni I lines as red-dotted lines and the strongest Fe I lines as green-dashed–dotted lines. On both panels, the horizontal green-dotted lines under the spectra delineate the feature bandpasses used, while the horizontal solid red lines under the spectra delineate the continuum regions used.
Other Images in This Article
Copyright and Terms & Conditions
© 2026. The Author(s). Published by the American Astronomical Society.

