

Image Details
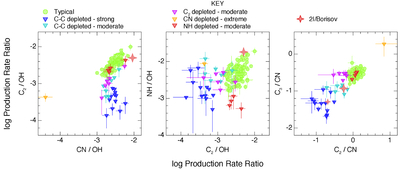
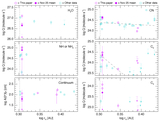
Caption: Figure 7.
Logarithmic abundance ratio plots from the restricted subset of our database, with the addition of 2I/Borisov as a red diamond star. Borisov’s mean abundance ratios from 2019 November 25 are represented by the larger diamond star and appear in all three plots. Our data from October 27 are represented by a smaller symbol and only appear in the last plot, as we did not observe OH and NH on this night; its C2-to-CN and C3-to-CN abundance ratios changed greatly between the 2 nights, moving Borisov from the strongly carbon-chain depleted class to the moderately carbon-chain depleted class as it approached perihelion.
Other Images in This Article
Copyright and Terms & Conditions
© 2026. The Author(s). Published by the American Astronomical Society.

