

Image Details
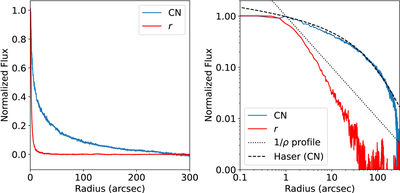
Caption: Figure 4.
Radial profiles from the 2019 October 27 unenhanced r and CN images shown in Figure 3. Both plots show the same data; the left plot has linear axes, while the right plot has logarithmic axes and includes 1/ρ and Haser CN profiles overlaid to guide the eye. Both overlaid profiles have been normalized to 1 at a radius of 1″. The Haser profile was generated by the sbpy “Haser” routine (M. Mommert et al. 2019) and uses the same scalelengths as described in the text (Section 2.2) scaled to the date of observations. Due to the lack of absolute calibration, both the observed and model profiles are normalized.
Other Images in This Article
Copyright and Terms & Conditions
© 2026. The Author(s). Published by the American Astronomical Society.

