

Image Details
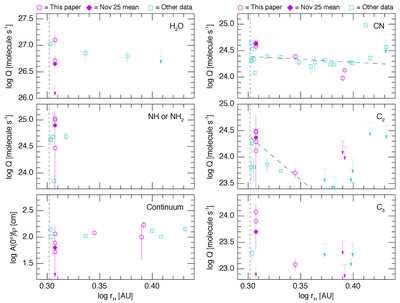
Caption: Figure 5.
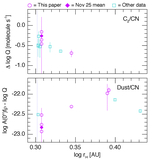
Logarithmic production rates for comet 2I/Borisov as a function of the log of the heliocentric distance (log rH). The data shown are from before its 2019 December 8 perihelion (q = 2.007 au, log q = 0.303 au; shown as a vertical dotted line). The data from this study are shown in purple, with individual detections represented by open circles, the average from 2019 November 25 represented by filled diamonds, and our upper limits for C2 and C3 denoted by dashes with attached downward arrows. Negative results or off-scale points associated with our November 25 observations are shown as purple downward arrows near the bottom of the H2O, C3, and continuum plots (see Table 4). Data from other studies are shown in light blue, with detections represented by open squares and upper limits again denoted by dashes with attached downward arrows. Our continuum values are from the green continuum, while others are from either the red continuum (A. Fitzsimmons et al. 2019; C. Opitom et al. 2019; E. Jehin et al. 2020b) or the V band (Z. Xing et al. 2020). The additional data are from A. Fitzsimmons et al. (2019), C. Opitom et al. (2019), J. de Leon et al. (2020), E. Jehin et al. (2020b), T. Kareta et al. (2020), H. W. Lin et al. (2020), A. J. McKay et al. (2020), Z. Xing et al. (2020), K. Aravind et al. (2021), G. P. Prodan et al. (2024), and S. Deam et al. (2026). The log rH-dependent fits are shown as dashed lines on the CN and C2 plots only, with some points excluded from the fits, as discussed in the text.
Other Images in This Article
Copyright and Terms & Conditions
© 2026. The Author(s). Published by the American Astronomical Society.

