

Image Details
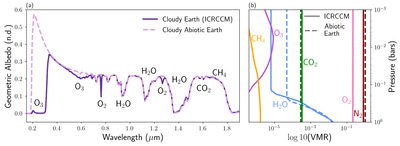
Caption: Figure 8.
(a) A comparison of reflected-light spectra for a realistic, cloudy Earth and the abiotic atmospheric state after 4.5 Gyr. The abiotic atmosphere lacks O2 (and therefore O3) and CH4, contributing to differences in absorption. (b) A comparison of the input molecular abundance profiles used to generate each reflected-light spectrum. We address minor differences between the CO2, H2O, and N2 profiles in the accompanying text. Though the true profiles extend to a TOA pressure of 1 × 10⁻⁵ bars, we only show the surface to the upper stratosphere to better emphasize the differences in the water-vapor profiles given the logarithmic scale.
Other Images in This Article
Copyright and Terms & Conditions
© 2026. The Author(s). Published by the American Astronomical Society.

