

Image Details
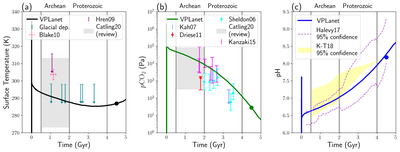
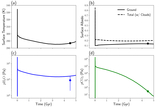
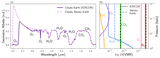
Caption: Figure 9.
Comparison of the VPLanet abiotic Earth model evolution (solid curves) against paleoclimate proxy reconstructions from the literature, following the framework of J. Krissansen-Totton et al. (2018). Vertical black lines demarcate the Archean (∼0.5–2.0 Gyr) and Proterozoic (∼2.0–4.0 Gyr) eons. Filled black, green, and blue circles mark PIE values. (a) Surface temperature evolution compared with glacial deposit occurrences (teal arrows; G. M. Young et al. 1998; G. E. Williams 2005; N. J. Geboy et al. 2013; G. Kuipers et al. 2013; R. W. Ojakangas et al. 2014; M. J. de Wit & H. Furnes 2016), δ18O and organic phosphate constraints (R. E. Blake et al. 2010; Blake10), δ18O and deuterium isotopes in 3.42 Ga cherts (M. Hren et al. 2009; Hren09), and the habitable temperature range reviewed in D. C. Catling & K. J. Zahnle (2020; Catling20). Downward arrows denote upper limits. (b) Atmospheric pCO2 evolution compared with cyanobacterial sheath calcification upper bounds (L. C. Kah & R. Riding 2007; Kah07), paleosol-based estimates from S. G. Driese et al. (2011; Driese11) and N. D. Sheldon (2006; Sheldon06), aqueous soil chemistry models (Y. Kanzaki & T. Murakami 2015; Kanzaki15), and the habitable range reviewed in D. C. Catling & K. J. Zahnle (2020). (c) Ocean pH evolution compared with 95% confidence intervals from the carbonate-alkalinity model of I. Halevy & A. Bachan (2017; Halevy17) and the coupled carbon-cycle model of J. Krissansen-Totton et al. (2018; K-T18).
Other Images in This Article
Copyright and Terms & Conditions
© 2026. The Author(s). Published by the American Astronomical Society.

