

Image Details
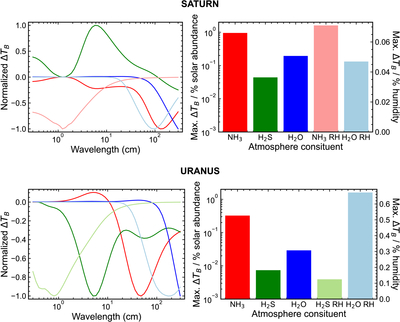
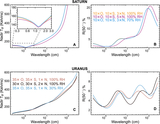
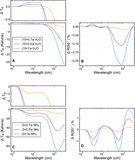
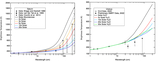
Caption: Figure 7.
Normalized change in brightness temperature as a function of wavelength (left) and peak values for the un-normalized curves (right) resulting from local linear perturbations of atmospheric composition for Saturn (top) and Uranus (bottom). The peak value is reported as a change in brightness temperature per percent change in solar-relative abundance or per percent change in relative humidity.
Other Images in This Article
Copyright and Terms & Conditions
© 2026. The Author(s). Published by the American Astronomical Society.

Copyright ©
2026 Astronomy Image Explorer. All Rights Reserved.
