

Image Details
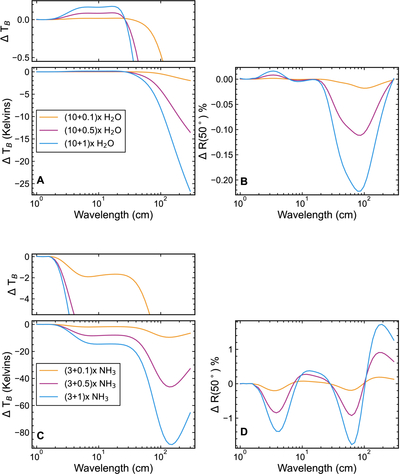
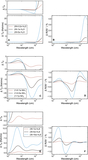
Caption: Figure 5.
Effect of perturbing the deep abundance of H2O (A), (B) and NH3 (C), (D) on Saturn’s microwave nadir spectrum (left) and 50° limb-darkening (right). Subplots above the ΔTB spectra show the same curves with different axis limits.
Other Images in This Article
Copyright and Terms & Conditions
© 2026. The Author(s). Published by the American Astronomical Society.

Copyright ©
2026 Astronomy Image Explorer. All Rights Reserved.
