

Image Details
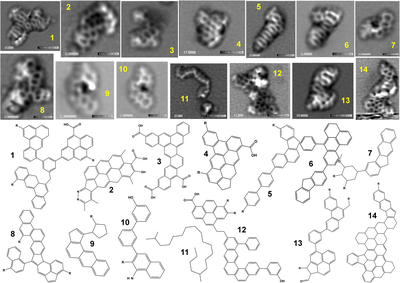
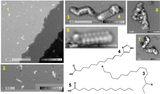
Caption: Figure 10.
Presented here are HR-AFM images of molecules found in the acetone extract of Murchison with potential structures provided beneath. The light gray scale bar shown on the left in each image is 5 Å long. The image grayscale represents the frequency shift (typical range: –10 Hz, …, +5 Hz), where brighter (more positive shift) means a more repulsive force is detected, whereas darker (more negative shift) means an attractive force is acting on the CO probe. The –R side groups of each range from –H, –CH3, –OH, –NH2, etc. While key core structures are clear, uncertainty remains about nonplanar side groups at the edges, which appear mostly very bright (partially out of the molecular core plane).
Other Images in This Article
Show More
Copyright and Terms & Conditions
© 2026. The Author(s). Published by the American Astronomical Society.

