

Image Details
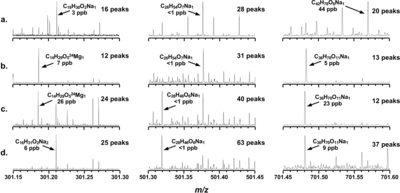
Caption: Figure 2.
Zoomed sections of 15 mDa at m/z 301, 501, and 701 from the (+) ESI 21T-MS analysis of the methanol extractions of Murchison (a) IM, (b) R1, and (c) R2, and Aguas Zarcas (d). The number of peaks present in each 15 mDa section is shown for each segment, as well as the assignment for the most abundant peak with the corresponding error.
Other Images in This Article
Show More
Copyright and Terms & Conditions
© 2026. The Author(s). Published by the American Astronomical Society.

Copyright ©
2026 Astronomy Image Explorer. All Rights Reserved.
