

Image Details
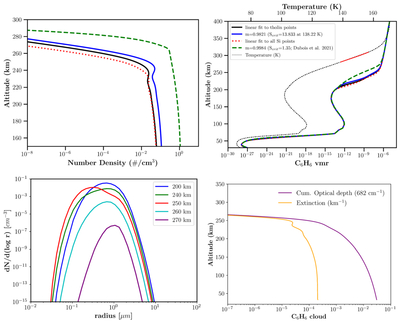
Caption: Figure 7.
Cloud particle number density (top left) and gas vmr profiles (top right) for model runs with different nucleation contact parameters. The 87°S temperature profile is shown as a black dotted line, and the portion relevant to our experimental temperature range (138–157 K) is indicated in red. Solid lines correspond to models run with the contact parameters calculated from the tholin laboratory measurements (linear fit, black; lowest temperature measurement, blue). For comparison, the red dotted line shows the model results when using the contact parameter calculated from the fit to all silicon Scrit measurements, and the green dashed line corresponds to model results obtained with contact parameter approximations based on a butane analog before the current benzene nucleation measurements were available (D. Dubois et al. 2021). (Bottom left) Calculated particle size distribution for five altitude levels obtained with the “linear fit” contact parameter. (Bottom right) Calculated cumulative optical depth and extinction obtained from the black number density curve (i.e., with the linear fit contact parameter) and the C6H6 refractive index of B. Schmitt et al. (2012) measured between 400 and 4199 cm−1.
Other Images in This Article
Copyright and Terms & Conditions
© 2026. The Author(s). Published by the American Astronomical Society.

