

Image Details
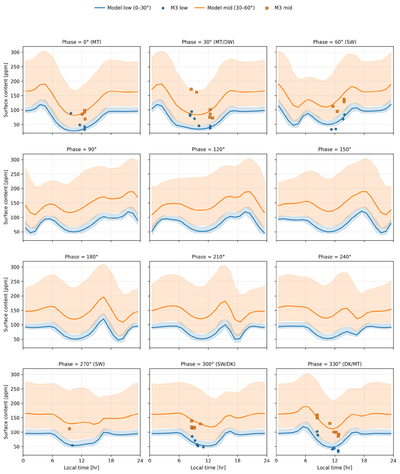
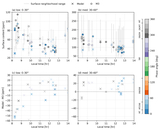
Caption: Figure 6.
Phase- and local-time-resolved comparison for the preferred case. Model local-time profiles and M3 comparison points for Ec = 0.520 eV and Ew = 0.090 eV, grouped by nearest 30° model phase bin. Blue shading shows the model abundance range across the low-latitude 0°–30° sampling interval, and orange shading shows the corresponding range across the midlatitude 30°–60° interval. Solid curves show the mean model abundance within each latitude interval. M3 points are plotted in the corresponding local-time and latitude bins. Phase labels identify the plasma regions sampled by the M3 points: MT, magnetotail; DW, dawn sheath; SW, solar wind; DK, dusk sheath. Mixed labels indicate phase bins containing M3 points from adjacent plasma regions.
Other Images in This Article
Copyright and Terms & Conditions
© 2026. The Author(s). Published by the American Astronomical Society.

