

Image Details
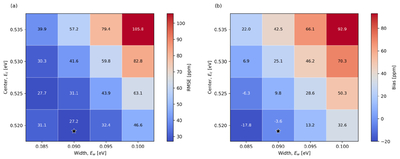
Caption: Figure 4.
Activation-energy parameter search. Low- and midlatitude model–data comparison metrics for the Gaussian effective activation-energy distribution. (a) RMSE (Equation (4)) between model and M3 inferred surface abundance. (b) Mean bias (Equation (5)) model minus M3 abundance. The star marks the preferred grid case, which has the lowest RMSE and a mean bias close to zero. The shallow minimum near Ec = 0.520 eV and Ew = 0.090 eV indicates a preferred effective activation-energy response region for the M3-sensitive reservoir, not a unique mineralogical activation energy.
Other Images in This Article
Copyright and Terms & Conditions
© 2026. The Author(s). Published by the American Astronomical Society.

Copyright ©
2026 Astronomy Image Explorer. All Rights Reserved.
