

Image Details
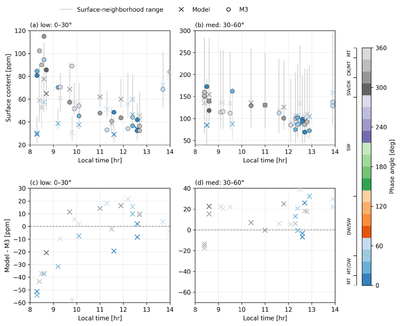
Caption: Figure 5.
Phase-averaged M3 measurement versus model comparison for Ec = 0.520 eV and Ew = 0.090 eV. M3-inferred surface abundances are compared with model abundances sampled at the corresponding phase, local-time, and latitude bins. Panels (a) and (b) show M3 and model surface abundance as a function of local time for the low-latitude 0°–30° and midlatitude 30°–60° bins, respectively. Model values are shown with cross symbols, and M3 values are shown with circles. Gray vertical bars in panels (a) and (b) show the range of model abundances sampled within the corresponding latitude and local-time bin. Panels (c) and (d) show signed residuals, defined as model minus M3 abundance. Points are colored by lunar phase angle, with magnetospheric sector labels shown next to the color bar.
Other Images in This Article
Copyright and Terms & Conditions
© 2026. The Author(s). Published by the American Astronomical Society.

