

Image Details
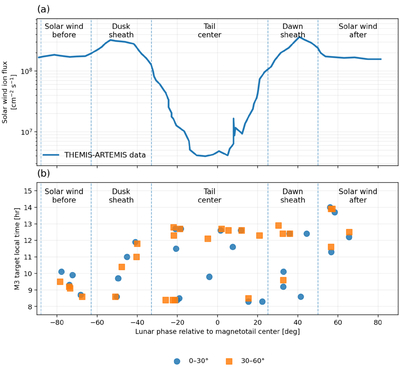
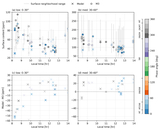
Caption: Figure 2.
Plasma source history and M3 comparison geometry. (a) Representative phase-dependent THEMIS-ARTEMIS ion flux used to scale the incident implanted H source in the model. Lunar phase is shown relative to the magnetotail center. (b) Low- and midlatitude M3 comparison targets plotted by lunar phase and local time. These sampling windows define the model–data comparison bins and show why the comparison must preserve phase, local time, and latitude rather than use a single averaged diurnal curve.
Other Images in This Article
Copyright and Terms & Conditions
© 2026. The Author(s). Published by the American Astronomical Society.

Copyright ©
2026 Astronomy Image Explorer. All Rights Reserved.
