

Image Details
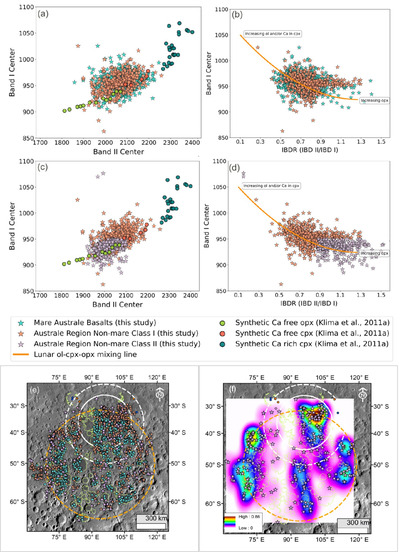
Caption: Figure 3.
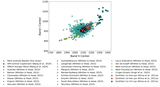
Spectral investigation of the Australe region. Band I Center versus Band II Center and Band I Center versus IBDR plots of (a) and (b) mare and nonmare Class I units and (c) and (d) nonmare Class I and Class II units of the Australe region. The band center values of the synthetic pyroxenes have been taken from R. L. Klima et al. (2011a) for classification of pyroxenes. The lunar ol–cpx–opx mixing line in (b) has been defined by (X. Zhang & E. Cloutis 2021a) and recalculated for IBDR by N. Panwar et al. (2023). (e) Distribution of the nonmare Class I (orange stars) and nonmare Class II (opx sites) (lilac stars) and Mare Australe basalts (light blue) in the Australe region. (f) Kernel density plot showing the density of the nonmare Class II spectra. The orange line traces the circular arrangement of the Mare Australe basalts, and the white lines mark the Australe North Basin. The blue, orange, and pink circles mark the locations of PAN, olivine, and opx, respectively, reported by K. L. Donaldson Hanna et al. (2014), M. Martinot et al. (2018), N. Panwar & N. Srivastava (2024), S. Tompkins & C. M. Pieters (1999), and S. Yamamoto et al. (2010). The data for this figure, which also supports Figures 2, 4, and 5, are available as the data behind the figure.
(The data used to create this figure are available in the online article.)
(The data used to create this figure are available.)
Other Images in This Article
Copyright and Terms & Conditions
© 2026. The Author(s). Published by the American Astronomical Society.

